Exam Q&As
In this section we cover key topics from Leaving Cert Business and Economics to help you achieve the best at your exam. Topics are introduced and supported by professionally worked out questions and answers.
Economic indicators provide an overview of some of the key economic developments in the Irish economy. By being familiar with these indicators, and knowing the direction in which they are going, you will be better able to understand what is going on in the economy around you.
For your leaving cert exam, you will be expected to know how to interpret several key indicators and comment on trends indicated. You will find the latest figures for a number of these key indicators in this section of the site including:
Economic Growth – is commonly measured as the percentage increase in gross domestic product (GDP) or gross national product (GNP) during one year.
Inflation – the steady and persistent increase in the general price level thus causing a fall in the value/purchasing power of money.
International Trade – the exchange (importing and exporting) of goods and services across international countries.
Government Finances – include the government’s fiscal policy, which can be defined as any action by the Government which affects the size, structure and timing of Government revenue and expenditure.
Unemployment – the percentage of people not in work, but who are available for and actively seeking work.
The Central Statistics Office (CSO) revise data on an ongoing basis. We update this data regularly to ensure the most up to date data available for students and teachers.
Economic growth is commonly measured as the percentage growth in Gross Domestic Product (GDP) or Gross National Product (GNP) over a period. GNP differs from GDP by the net amount of incomes sent to, or received from abroad. In an open economy like Ireland, where multinational corporations play an important role (particularly via exports), the difference between GDP and GNP can be significant. This is due to the fact that profit outflows from multinationals can be much higher than income received from abroad by Irish companies.
Would you expect GDP to be higher than GNP? In Ireland’s case, GDP is actually larger than GNP. This is because the net factor income from abroad is usually negative due to the following reasons:
Note: Data for the Quarterly National Accounts (QNA) which forms the basis of GDP and GNP calculations are collected from a broad range of sources across all sectors of the economy. However, due to the temporary closures relating to COVID-19 and the difficulties faced by all participants in the economy, including businesses, households response rates to various CSO surveys were lower than normal hence the CSO had to rely on estimating some of the data. It should be noted that as better data becomes available, revisions to numbers for 2020 can be expected.
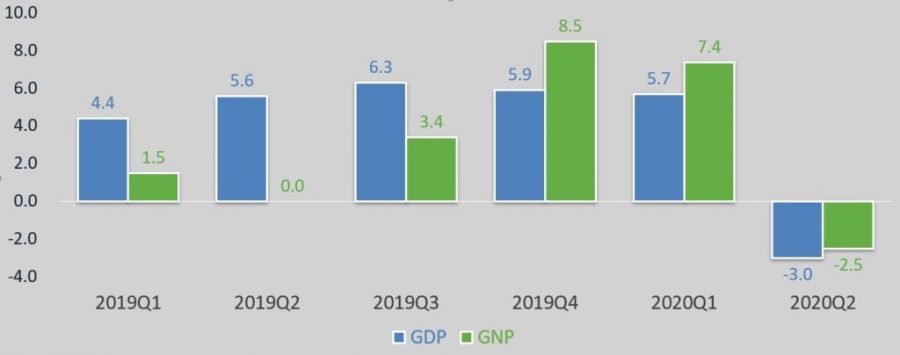
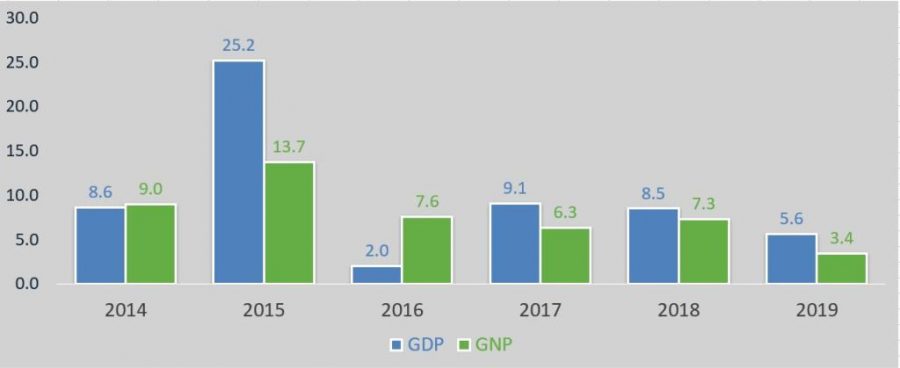
GDP increased by 5.6 per cent in 2019, whereas growth in GNP was 3.4 per cent in 2019. As the Irish economy heavily depends on multinational companies, GDP figures may not fully reflect all aspects of Irish economic activity particularly domestic activity. Hence in 2016 a review group recommended that an indicator of the Irish economy adjusted for the globalisation activities to be developed.
As part of this recommendation the CSO developed a series termed Modified Gross National Income (GNI*) and this indicator was published for the first time in 2017. The most recent data shows that in 2018, GDP at current market prices was around €324 billion whereas GNI* was €197.5 billion showing the effect of some of the activities associated with multinational companies, such as research and development service imports, trade in in intellectual property and aircraft leasing.
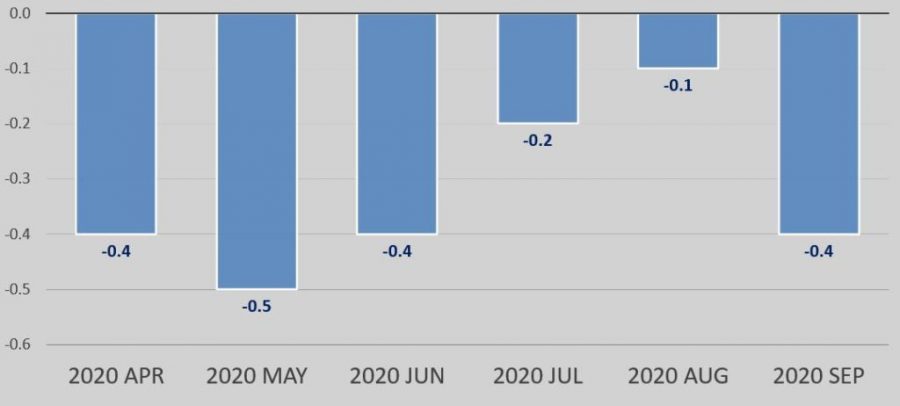
Inflation is the steady and persistent rate of change in the level of prices in an economy. The most common measure of inflation is the Consumer Price Index (CPI) which is the overall change in the prices of goods and services that people typically buy over time. In Ireland, the Central Statistics Office (CSO) collects approximately 53,000 prices every month and compares these to the corresponding prices from the previous month in order to construct the CPI.
Note: Inflation calculation methodologies had to be adjusted by the CSO due to COVID 19 restrictions. Price information was mainly collected from websites rather than in-store as in previous years. In addition consumption of some goods and services ceased during certain months due to lock down measures hence these consumption changes had to be factored in to the calculations.
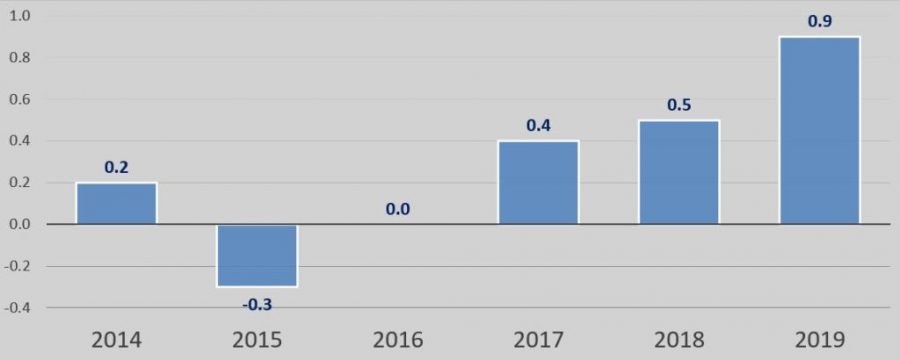
The annual average rate of inflation in 2019 was 0.9%. This compares to 0.5% and 0.4% increase in 2018 and 2017, respectively. The largest year-on-year price increase was recorded in April 2019 when prices rose by 1.7%. The largest price rises were recorded for Housing, Water, Electricity, Gas & Other Fuels (+3.8%) and Restaurant and Hotels (+3.0%).
Over the period 2015 to 2019, the largest increases were recorded for Housing, Water, Electricity, Gas & Other Fuels (+10.8%), Restaurants & Hotels (+9.8%) and Education (+9.2%). The largest decreases were for Furnishings, Household Equipment & Routine Household Maintenance (-13.8%), Clothing & Footwear (-9.4%) and Communications ( 7.4%).
Exports of goods and services represent the value of all goods and other market services provided to the rest of the world from an economy. The relative openness of an economy is generally measured by: the ratio of exports of goods and services from an economy, to the level of GDP in that economy.
Note: Services exports decreased by around €3bn in second quarter of 2020 compared to the second quarter of 2019, mainly due to lower Transport and Tourism & Travel services exports, due to COVID-19 restrictions on travel.
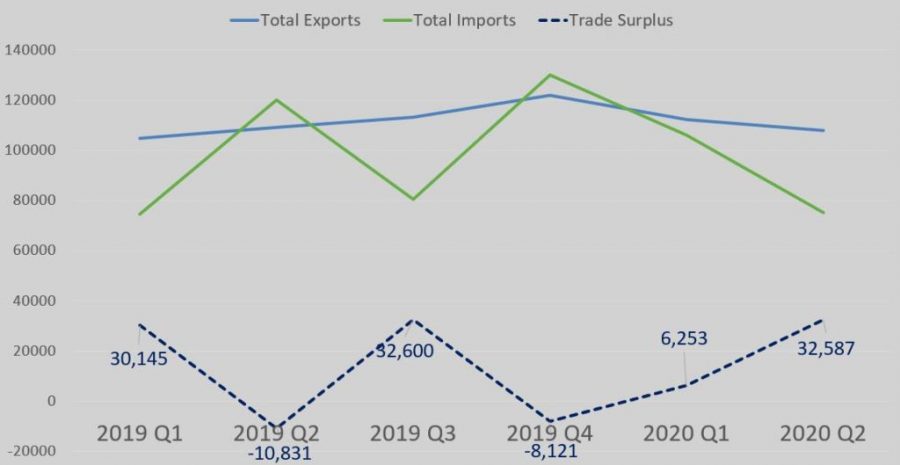
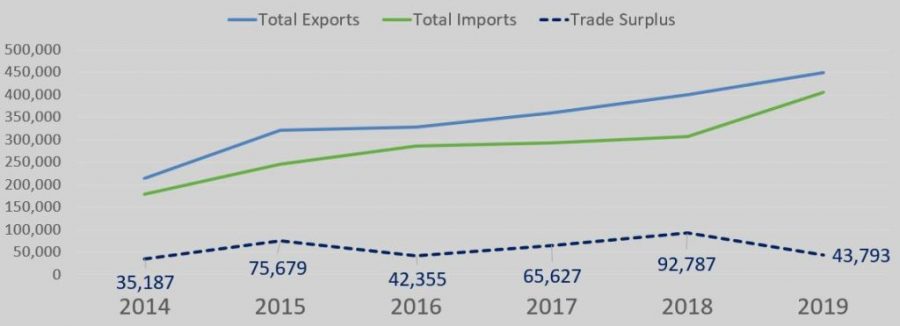
Overall merchandise and services exports amounted to over €448.9 billion in 2019 with imports to the value of €405.1 billion leaving a trade surplus of over €43.8 billion in goods and services.
Service exports are an important contributor to the overall export performance of the Irish economy. In 2019 service exports amounted to €221.4 billion where international financial services related activities accounted for around 7.6% of all service exports from Ireland.
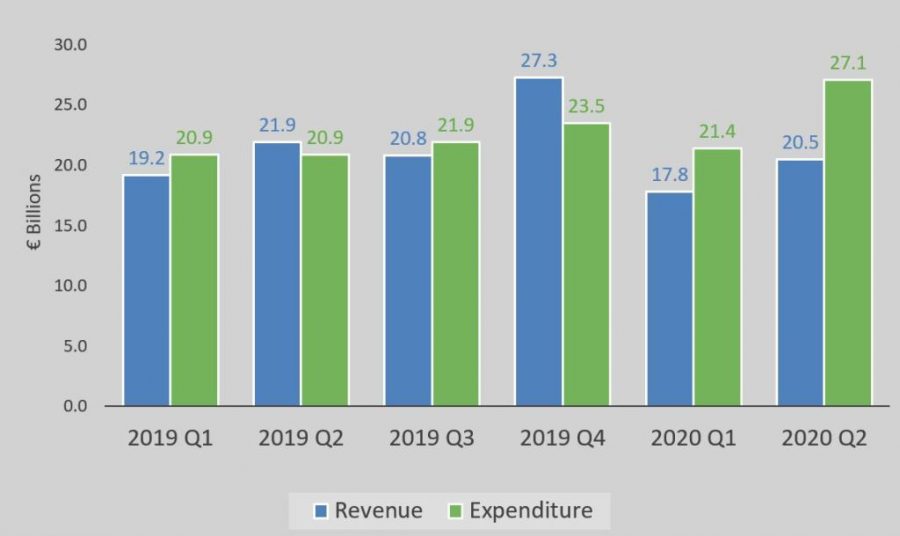
In March 2020, in response to the Covid-19 pandemic, the Government introduced measures to increase the capacity of the health sector and provide supports to businesses and households. These measures were in place for the duration of the second quarter. As a result, there was a direct impact on the level of expenditure (up €6.2 billion compared with Q2 2019) while revenue has declined, linked to both the measures and restrictions that were put in place. General government recorded a deficit of €10.2 billion (5.8% of quarterly GDP) in the first half of 2020.
In the first six months of 2020, government revenue was 6.7 per cent lower than the same period of 2019. Indirect taxes were down 23.5 per cent, predominantly due to reduced VAT receipts, with direct taxes (including corporation tax and income tax) were up 8.7 per cent.
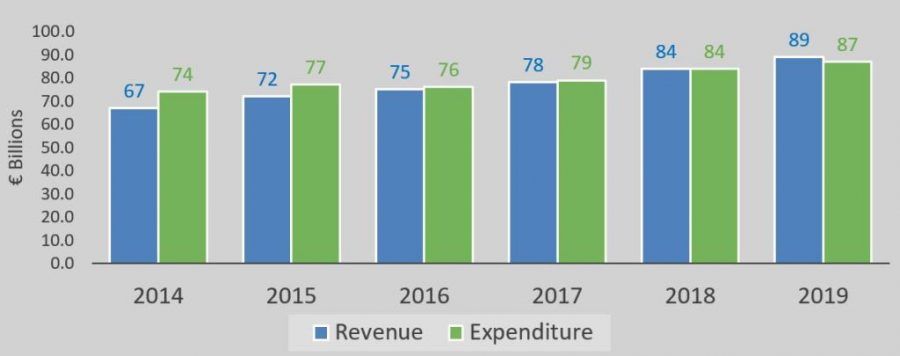
At the end of 2019 government revenue was €89.1 billion with expenditure coming in at €87.3 billion resulting in a government surplus of around €1.9 billion (0.5% of GDP), an improvement on the 2018 surplus of €400 million (0.1% of GDP). The nominal general government gross debt (GG Debt) stood at €204.2 billion at the end of 2019 (57.4% of GDP) compared with the 2018 figure of €205.9 billion (63% of GDP).
With increased levels of borrowing required to support the fiscal impact and response to Covid-19, gross general government debt increased by €22 billion since the end of 2019 to €226 billion as of end of second quarter of 2020.
The rate of unemployment measures the percentage of people who are not in work, but who are available for and actively seeking work.
It is generally accepted that zero unemployment is unlikely, even when an economy is operating at full capacity. This is due to various factors such as availability of job information, skills and education and the degree of labour mobility. For this reason, a full rate of employment is generally considered to exist when unemployment is around 4% in an economy.
Note: A range of measures have been introduced by the Government in relation to providing income support for those whose employment has been affected due to the COVID-19 pandemic in Ireland. Those in receipt of the COVID-19 income supports do not meet the criteria to be considered as unemployed for the purposes of the compilation of the results for the standard monthly unemployment estimates published by the CSO.
Therefore the CSO created alternative COVID-19 Adjusted Measure of Unemployment to supplement the standard monthly unemployment measure. Together these measures can be considered as being the upper and lower bound respectively of the true unemployment rate. Data below are from the standard monthly unemployment measures published by the CSO.
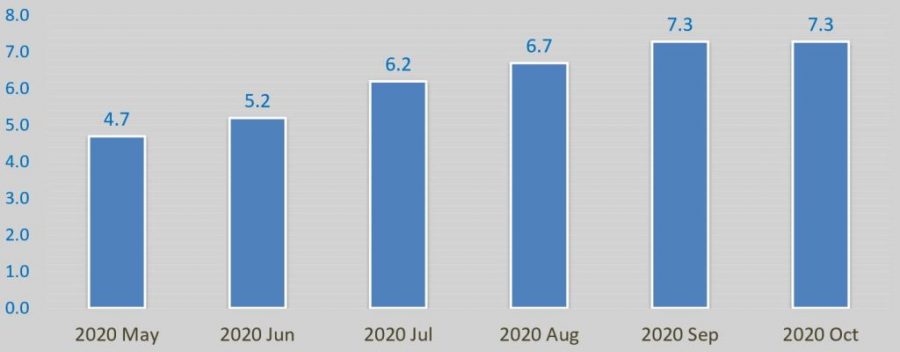
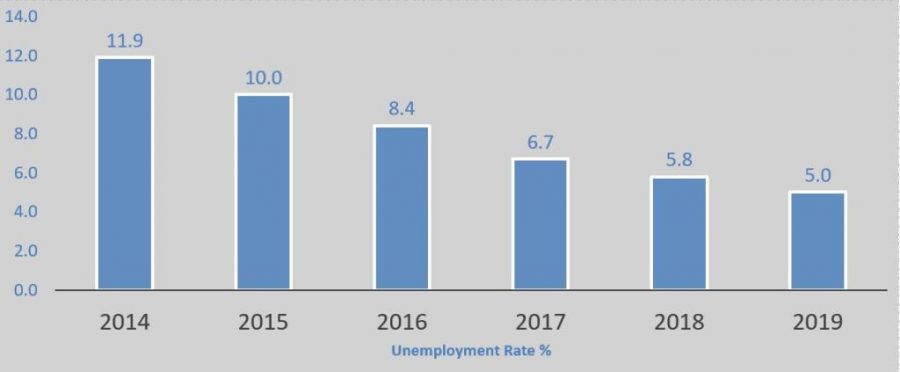
Annual unemployment rate in Ireland in 2019 was 5% compared to 5.8% in 2018 and the peak unemployment rate of 15.5% back in 2012. Data prior to the COVID-19 pandemic showed that there was an annual increase in employment of 2.2% or 51,700 in the year to the first quarter of 2020, bringing total employment to 2,353,500. Employment increased in 10 of the 14 economic sectors over the year as end of first quarter of 2020. The largest rate of increase was recorded in the Information and Communication sector (+8.3% or +9,800).
The latest figures available indicate that the seasonally adjusted unemployment rate for the EU-27 for August 2020 was 7.4% compared to monthly unemployment rate of 7.2% for Ireland during the same period.
In this section we cover key topics from Leaving Cert Business and Economics to help you achieve the best at your exam. Topics are introduced and supported by professionally worked out questions and answers.
Contact Us
BusinessEducation.ie has been developed by Banking & Payments Federation of Ireland (BPFI) in collaboration with the Business Teachers’ Association of Ireland (BSTAI). If you have any questions about the resource, please contact us at businesseducation@bpfi.ie.

| Cookie | Type | Duration | Description |
|---|---|---|---|
| _ga | Persistent | 2 years | Google/Analytics Cookie. Registers a unique ID that is used to generate statistical data on how the visitor uses the website. |
| _gat | Session | Expires when browser is closed | Google/Analytics Cookie. Used by Google Analytics to throttle request rate. |
| _gid | Session | Expires when browser is closed | Google/Analytics Cookie. Registers a unique ID that is used to generate statistical data on how the visitor uses the website. |
| cli_user_preference | Persistent | 1 year | The cookie is set by the GDPR Cookie Consent plugin and is used to store whether or not user has consented to the use of cookies. It does not store any personal data. |
| CONSENT | 2 years | YouTube sets this cookie via embedded youtube-videos and registers anonymous statistical data. | |
| cookielawinfo-checkbox-advertisement | 1 year | Set by the GDPR Cookie Consent plugin, this cookie is used to record the user consent for the cookies in the "Advertisement" category . | |
| cookielawinfo-checkbox-analytics | 1 year | Set by the GDPR Cookie Consent plugin, this cookie is used to record the user consent for the cookies in the "Analytics" category . | |
| cookielawinfo-checkbox-functional | 1 year | The cookie is set by the GDPR Cookie Consent plugin to record the user consent for the cookies in the category "Functional". | |
| cookielawinfo-checkbox-necessary | Session | Expires when browser is closed | This cookie is used to check if necessary cookies can be placed. It works only in coordination with the primary cookie. |
| cookielawinfo-checkbox-non-necessary | Session | Expires when browser is closed | This cookie is to check if non-necessary cookies can be placed. It works only in coordination with the primary cookie. |
| cookielawinfo-checkbox-others | 1 year | Set by the GDPR Cookie Consent plugin, this cookie is used to store the user consent for cookies in the category "Others". | |
| cookielawinfo-checkbox-performance | 1 year | Set by the GDPR Cookie Consent plugin, this cookie is used to store the user consent for cookies in the category "Performance". | |
| elementor | never | This cookie is used by the website's WordPress theme. It allows the website owner to implement or change the website's content in real-time. | |
| Google Maps Cookies | Third-party | Most of the cookies expire 10 years after your last visit to a page containing a Google Map. | If you are logged into a Google account, Google may set a number of cookies on any page that includes a Google Map. They include a mixture of pieces of information to measure the number and behaviour of Google Maps users. Various unique identifiers, except for PREF which stores your options such as preferred zoom level. View Google's Privacy Policy. |
| Google reCAPTCHA | Third-party | These are essential site cookies, used by the google reCAPTCHA for the prevention of spam. These cookies use an unique identifier for tracking purposes. Click here for an overview of privacy at Google | |
| Twitter Cookies | Third-party | If you are logged in on Twitter, Twitter detects with every call-up to our website and for the entire duration of your stay on our website which specific sub-page of our website was visited by you. This information is collected through the Twitter component and associated with the respective Twitter account of the data subject. If the data subject clicks on one of the Twitter buttons integrated on our website, then Twitter assigns this information to the personal Twitter user account of the data subject and stores the personal data. | |
| viewed_cookie_policy | Persistent | 1 year | The primary cookie that records the user consent for the usage of the cookies upon ‘accept’ and ‘reject.’ It does not track any personal data and is set only upon user action (accept/reject). This cookies stores your cookies preferences so the cookie banner doesn't pop up again. |
| VISITOR_INFO1_LIVE | 5 months 27 days | A cookie set by YouTube to measure bandwidth that determines whether the user gets the new or old player interface. | |
| vuid | 2 years | Vimeo installs this cookie to collect tracking information by setting a unique ID to embed videos to the website. | |
| YSC | session | YSC cookie is set by Youtube and is used to track the views of embedded videos on Youtube pages. | |
| yt-remote-connected-devices | never | YouTube sets this cookie to store the video preferences of the user using embedded YouTube video. | |
| yt-remote-device-id | never | YouTube sets this cookie to store the video preferences of the user using embedded YouTube video. | |
| yt.innertube::nextId | never | This cookie, set by YouTube, registers a unique ID to store data on what videos from YouTube the user has seen. | |
| yt.innertube::requests | never | This cookie, set by YouTube, registers a unique ID to store data on what videos from YouTube the user has seen. |
| Cookie | Duration | Description |
|---|---|---|
| cli_user_preference | 1 year | The cookie is set by the GDPR Cookie Consent plugin and is used to store whether or not user has consented to the use of cookies. It does not store any personal data. |
| cookielawinfo-checkbox-advertisement | 1 year | Set by the GDPR Cookie Consent plugin, this cookie is used to record the user consent for the cookies in the "Advertisement" category . |
| cookielawinfo-checkbox-analytics | 1 year | Set by the GDPR Cookie Consent plugin, this cookie is used to record the user consent for the cookies in the "Analytics" category . |
| cookielawinfo-checkbox-functional | 1 year | The cookie is set by the GDPR Cookie Consent plugin to record the user consent for the cookies in the category "Functional". |
| cookielawinfo-checkbox-necessary | Expires when browser is closed | This cookie is used to check if necessary cookies can be placed. It works only in coordination with the primary cookie. |
| cookielawinfo-checkbox-non-necessary | Expires when browser is closed | This cookie is to check if non-necessary cookies can be placed. It works only in coordination with the primary cookie. |
| cookielawinfo-checkbox-others | 1 year | Set by the GDPR Cookie Consent plugin, this cookie is used to store the user consent for cookies in the category "Others". |
| cookielawinfo-checkbox-performance | 1 year | Set by the GDPR Cookie Consent plugin, this cookie is used to store the user consent for cookies in the category "Performance". |
| elementor | never | This cookie is used by the website's WordPress theme. It allows the website owner to implement or change the website's content in real-time. |
| viewed_cookie_policy | 1 year | The primary cookie that records the user consent for the usage of the cookies upon ‘accept’ and ‘reject.’ It does not track any personal data and is set only upon user action (accept/reject). This cookies stores your cookies preferences so the cookie banner doesn't pop up again. |
| Cookie | Duration | Description |
|---|---|---|
| Google Maps Cookies | Most of the cookies expire 10 years after your last visit to a page containing a Google Map. | If you are logged into a Google account, Google may set a number of cookies on any page that includes a Google Map. They include a mixture of pieces of information to measure the number and behaviour of Google Maps users. Various unique identifiers, except for PREF which stores your options such as preferred zoom level. View Google's Privacy Policy. |
| Google reCAPTCHA | These are essential site cookies, used by the google reCAPTCHA for the prevention of spam. These cookies use an unique identifier for tracking purposes. Click here for an overview of privacy at Google | |
| Twitter Cookies | If you are logged in on Twitter, Twitter detects with every call-up to our website and for the entire duration of your stay on our website which specific sub-page of our website was visited by you. This information is collected through the Twitter component and associated with the respective Twitter account of the data subject. If the data subject clicks on one of the Twitter buttons integrated on our website, then Twitter assigns this information to the personal Twitter user account of the data subject and stores the personal data. |
| Cookie | Duration | Description |
|---|---|---|
| _ga | 2 years | Google/Analytics Cookie. Registers a unique ID that is used to generate statistical data on how the visitor uses the website. |
| _gat | Expires when browser is closed | Google/Analytics Cookie. Used by Google Analytics to throttle request rate. |
| _gid | Expires when browser is closed | Google/Analytics Cookie. Registers a unique ID that is used to generate statistical data on how the visitor uses the website. |
| CONSENT | 2 years | YouTube sets this cookie via embedded youtube-videos and registers anonymous statistical data. |
| vuid | 2 years | Vimeo installs this cookie to collect tracking information by setting a unique ID to embed videos to the website. |
| Cookie | Duration | Description |
|---|---|---|
| VISITOR_INFO1_LIVE | 5 months 27 days | A cookie set by YouTube to measure bandwidth that determines whether the user gets the new or old player interface. |
| YSC | session | YSC cookie is set by Youtube and is used to track the views of embedded videos on Youtube pages. |
| yt-remote-connected-devices | never | YouTube sets this cookie to store the video preferences of the user using embedded YouTube video. |
| yt-remote-device-id | never | YouTube sets this cookie to store the video preferences of the user using embedded YouTube video. |
| yt.innertube::nextId | never | This cookie, set by YouTube, registers a unique ID to store data on what videos from YouTube the user has seen. |
| yt.innertube::requests | never | This cookie, set by YouTube, registers a unique ID to store data on what videos from YouTube the user has seen. |